Analysis of the health in the weaners and fattening stages; a different approach (II)
14-Sep-2012 (13 years 10 months 7 days ago)
With respect to the distribution according to the age and the cause, the analysis shows the following:
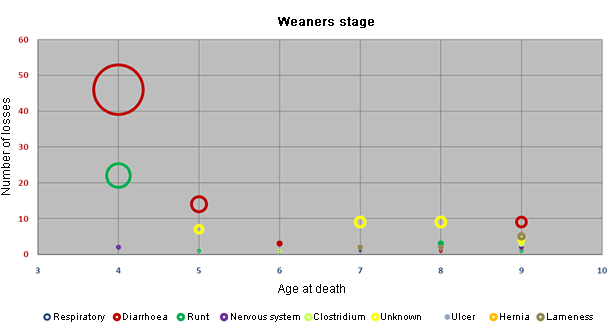
Graph 6: Distribution of the losses according to the age and the cause in the weaners stage in the group of farms with diarrhoea problems. (N.B.: In the weaners stage, the losses of piglets older than 9 weeks are included in week 9; and in the fattening stage, the losses of piglets younger than 10 weeks are included in weeek 10)
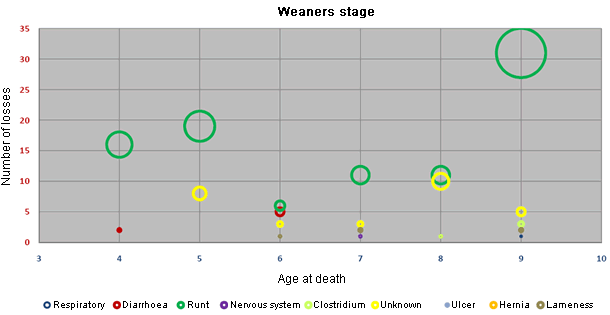
Graph 7: Distribution of the losses according to the age and the cause in the weaners stage in the group of farms without diarrhoea problems. (N.B.: In the weaners stage, the losses of piglets older than 9 weeks are included in week 9; and in the fattening stage, the losses of piglets younger than 10 weeks are included in weeek 10).
In the previous graphs we can see, at first glance, the difference with respect to the causes of the losses between some farms and the others (according to the colour of the circle, the cause of the loss will be one or another one, and the bigger the circle, the higher the number of losses). But also, these graphs allow us to analyze the age of the piglets when they die. In this way, we can see that the losses due to diarrhoea are concentrated, basically, during the first week in which the piglets are in the weaners stage, whilst in the farms that have not had diarrhoea problems, the mortality is distributed more evenly, but it is mainly concentrated in the final phase of the weaners stage (piglets that are runts and that are culled before taking them to the fattening stage).
Next, we make the same analysis but in the fattening stage:
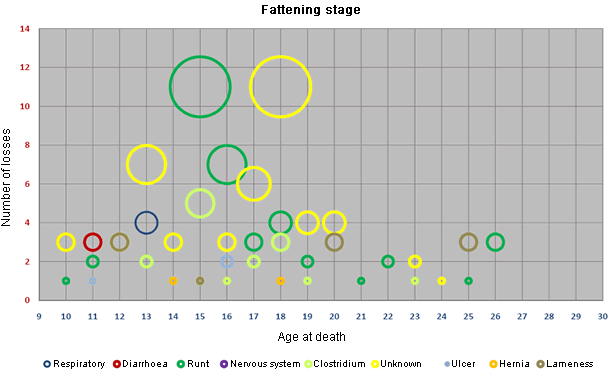 Graph 8: Distribution of the losses according to the age and the cause during the fattening stage in the group of farms with diarrhoea problems. (N.B.: In the weaners stage, the losses of piglets older than 9 weeks are included in week 9; and in the fattening stage, the losses of piglets younger than 10 weeks are included in week 10).
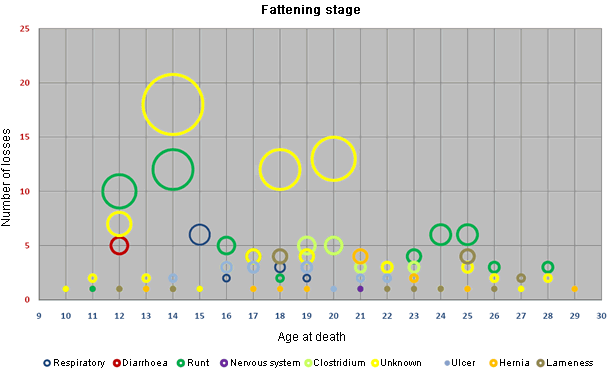 Graph Graph 9: Distribution of the losses according to the age and the cause during the fattening stage in the group of farms without diarrhoea problems. (N.B.: In the weaners stage, the losses of piglets older than 9 weeks are included in week 9; and in the fattening stage, the losses of piglets younger than 10 weeks are included in weeek 10).
The distribution of the losses, according to the causes and the age, in the fattening stage, is similar in both groups. In summary, the global percentage of losses in the two groups is similar, but when analyzing the two stages separately, we can see a clear difference between the two groups in the weaners stage: the piglets do not die due to the same causes (in group 1 the main cause is diarrhoea, and in group 2 the runts), nor in the same moment (in group 1 they die at the beginning of the weaners stage, and in group two during all the weaners stage, but mainly at the end of this stage).
% Mortality according to the age
Graph 10: Distribution of the losses according to their age. Farms with diarrhoea problems vs farms without diarrhoea problems.
In the farms with diarrhoea problems, the diarrhoea is concentrated in the first week in which the piglets are in the weaners stage, whilst in the rest of the farms, the causes are more varied, and they are distributed along all the ages.
Lastly, in order to try to find out the cause of the increase of the diarrhoea problems, we analyzed the distribution, with respect to the weeks of the year, of the losses due to this cause in each individual farm of the group with diarrhoea problems, as well as the global results in this group. The results are as follows:
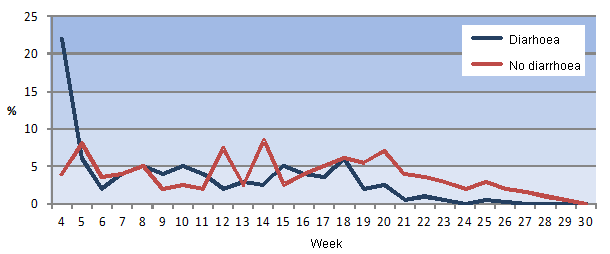
Losses due to diarrhoea acccording to the week of the year
Graph 11: Distribution of the losses due to diarhoea according to the week of the year and the global results.
In general (and especially in one of the farms), there was a strong increase during week 48, and after that there was a progressive drop. Analyzing the temperatures in the region during that period, we could see that, at the beginning of week 48, there was a sudden drop of the temperatures ("winter started"). So, what happened (and it implies a rearing error that is, unfortunately, more frequent than it should) was that this temperature drop caught the farmers of some farms by surprise, and they did not prepare the rooms for the low temperatures (they were used to not preheating the weaners rooms because with the environmental temperature they obtained the minimum temperatures without preheating; nevertheless, when the temperature dropped, the rooms did not reach the minimum necessary temperature). Once they started to act appropriately, the problem was solved.
So, the conclusions of the analyses would be as follows:
- The origin of the problem is clear: it was limited to only a small % of the farms, and the cause was a rearing error. Obviously, this error should not happen again.
- The second part of the analysis is the most interesting one. As we have said, the farms with diarrhoea problems have a global mortality that is scarcely a 0,4% higher than the rest during the period of time that was studied, and with this problem, what has happened is that the losses have accumulated during the beginning of the stay of the piglets in the weaners stage, insted of being spread along different ages. This could make us think that the fact that the piglets die at the beginning of this stage could be something beneficial, because they are piglets that have eaten almost no compound feed, but... is this really so? Obviously, the conclusion is the opposite one, because when newly weaned piglets enter cold rooms, all the piglets (and not only the ones that die) become affected. So:
-
If the monitoring of the mortality in these rooms was carried out in the case of the batches that entered cold rooms, we would probably see a subsequent low but constant number of losses (piglets that remain affected), and the global mortality % of each batch would probably be higher.
- The medication costs of these batches will probably be higher (the diarrhoea would affect more piglets, and not only those that die), although this will have to be checked in subsequent batches.
- An important part of the piglets would not have a good start in this stage. This piglets would give us problems later on, and this would give place to problems as, for instance:
- A higher consumption of compound feed during the early stages and a higher global feed conversion index.
- A higher heterogeneity, that would give place to higher differences in the weights and the ages at which the pigs are taken to the abattoir.
- A higher consumption of compound feed during the early stages and a higher global feed conversion index.
So, the importance of a correct data collection in the weaners and the fattening stages is evident, as it is also the case of an adequate global analysis, in order to avoid erroneous conclusions that could entail a great harm for a part of the production that is very important from the economic point of view.