Anoestrus upon weaning
16-May-2012 (14 years 1 months 29 days ago)
The weaning to service interval is one of the most important factors that influences Non Productive Days (NPD) and therefore also influences a farm’s productivity (weaned piglets/mated sow, per year). This is due to the fact that, although it doesn’t take many days to mate a weaned sow, it is something that occurs 2-3 times per year and affects up to 75% of our dams; therefore it’s an important factor that we must keep in mind.
With an average interval of over 6,5 days, we can conclude that post-weaning anoestrus exists and we will have to keep an eye on what’s happening on the farm. Another limitation is due to the % of late-mated sows we have (that is to say, those that mate more than 7 days after weaning). If this number reaches 10%, it is time to take action.
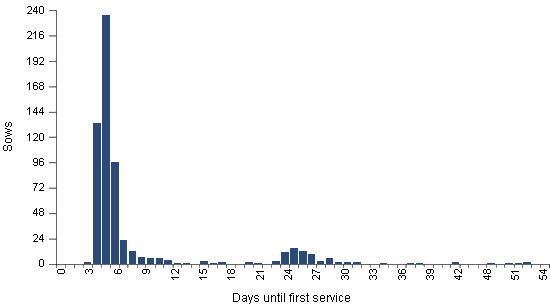
In order to study anoestrus, it is useful to begin grouping by weaning to service intervals, as shown in the following example:
| 0-3 | 4 | 5 | 6 | 7 | 8-20 | 21-25 | 26-29 | 30- | Total | |
| 1st mating | 8 | 549 | 304 | 43 | 17 | 48 | 5 | 0 | 9 | 983 |
| % mated | 0.8 | 55.8 | 30.9 | 4.4 | 1.7 | 4.9 | 0.5 | 0.0 | 0.9 | 100 |
| Weaning to service interval | 1.8 | 4.0 | 5.0 | 6.0 | 7.0 | 11.6 | 22.6 | 134.0 | 6.1 |
This farm has a weaning to service interval of 6.1 and the percentage of late-mated sows is 6.3%, so it would be considered a farm with the correct weaning to service interval. However, their grouping by intervals shows us that:
- The majority of sows that go into estrus 4-5 days post-weaning (as it happens on almost all farms). A small percentage of sows go into estrus between 0 and 3 days post-weaning and another small percentage between 6-7 days post-weaning. In this group, we would have to watch the % of sows that go into estrus 6-7 days after post-weaning, since they are most likely sows that have either haven’t had the correct stimulation in order to go into estrus, or they are exposed to a decreased photoperiod. In the first case we can act by using the male effect (heat detection) or the female effect (sows going into estrus stimulate others to do the same). Photoperiod problems are found in sows weaned from the second half of summer and the beginnings of fall that delay going into estrus and therefore result in lower birth rates.
-
The 8-20 days post-weaning group corresponds to two types of sows, both a consequence of inadequate management during lactation:
- Sows that have gone into estrus during lactation, due to excessive stress or lack of prolactin production (that is to say, milk production has diminished brusquely, although they haven’t completely dried out). Here we include sows that have gone through an excessive partial weaning, nursing sows that have been saddled with piglets smaller than their own, as well as litters of weak piglets (with diarrhea or excessively small in size). This has been worsened over the last few years with hyper productive sows where the loss of one or several piglets unleashes estrus during lactation.
- Sows that have lost a lot of physical condition in lactation, so it’s hard for them to initiate the hormonal process which leads to estrus.
- The 21-25 days group corresponds to sows that have gone into estrus between 0 and 4 days post-weaning and estrus wasn’t detected. This group isn’t large, but indicates defects in heat detection.
-
The 26-29 day group corresponds to sows that have gone into estrus 4-5 days post-weaning, but estrus wasn’t detected. This can be due to:
- Bad body condition which has led to a silent heat, difficult to detect.
- Defects in heat detection, which doesn’t allow detection in the moment of estrus.
- Lastly, the over 29-days group indicated an accumulation of several other previous problems.
Therefore, in the face of a weaning to service interval, we should break it down by groups, evaluate which is the group or groups that have increased, and act accordingly.
Here we will analyze two examples of extreme management:
1) Long weaning to service interval with an elevated birth rate
| Objective | 9/09 | 10/09 | 11/09 | 12/09 | 1/10 | 2/10 | 3/10 | 4/10 | 5/10 | 6/10 | 7/10 | 8/10 | Yearly average | |
| Wean-Serv.Int. | 7.5 | 9.8 | 8.3 | 6.9 | 7.6 | 10.1 | 9.5 | 13.5 | 12.1 | 12.8 | 11.7 | 8.3 | 8.4 | 10.0 |
| Returns (%) | 4 | 1.4 | 6.0 | 5.8 | 8.5 | 2.7 | 3.3 | 1.3 | 7.8 | 4.0 | 4.1 | 7.0 | 4.7 | 4.7 |
| Early returns (< 18 d) | 0.0 | |||||||||||||
| Cyclic returns (18-25 d) | 1.4 | 1.2 | 4.3 | 7.0 | 1.3 | 3.3 | 1.3 | 7.8 | 2.7 | 5.6 | 4.7 | 3.4 | ||
| Acyclic returns (26-37 d) | 4.8 | 1.4 | 1.4 | 1.3 | 2.7 | 1.4 | 1.4 | 1.2 | ||||||
| Cyclic returns (38-46 d) | 0.0 | |||||||||||||
| Late returns (> 46 d) | 1.3 | 0.1 | ||||||||||||
On this farm, what they do is assure the bodily condition of the sows at the time of service. Therefore, for the thinnest sows, they let estrus pass (so that their average weaning to service interval rises to 10 days), but they assure very few reproductive failures (actually, fertility is 93%).
2) Short weaning to service interval with low birth rates.
| Objective | 10/09 | 11/09 | 12/09 | 1/10 | 2/10 | 3/10 | 4/10 | 5/10 | 6/10 | 7/10 | 8/10 | 9/10 | Yearly average | |
| Wean.-Serv- Int. | 5 | 5.8 | 5.7 | 4.4 | 5.3 | 5.2 | 5.0 | 4.8 | 4.7 | 4.2 | 4.2 | 4.4 | 4.7 | 4.9 |
| Returns (%) | 10 | 10.1 | 15.9 | 9.6 | 14.7 | 9.6 | 12.6 | 15.4 | 13.1 | 15.4 | 17.2 | 11.3 | 14.9 | 13.4 |
| Early returns (< 18 d) | 0.9 | 1.2 | 1.3 | 4.8 | 0.9 | 2.9 | 0.9 | 1.3 | 2.2 | 2.1 | 1.0 | 1.6 | ||
| Cyclic returns (18-25 d) | 2.2 | 5.3 | 1.2 | 2.7 | 3.6 | 3.8 | 3.7 | 7.7 | 7.5 | 7.2 | 3.0 | 4.1 | ||
| Acyclic returns (26-37 d) | 3.4 | 6.2 | 6.0 | 2.7 | 2.4 | 2.7 | 6.7 | 3.7 | 6.4 | 2.2 | 1.0 | 5.9 | 4.1 | |
| Cyclic returns (38-46 d) | 2.2 | 2.7 | 1.2 | 4.0 | 1.2 | 1.8 | 1.9 | 2.8 | 2.2 | 1.0 | 3.0 | 2.0 | ||
| Late returns (> 46 d) | 2.2 | 0.9 | 4.0 | 1.2 | 3.6 | 1.9 | 3.2 | 2.0 | 1.6 | |||||
This is a contrary case: practically all the sows are mated between 4-5 days, however their % of returns (especially the acyclic ones) is high, and so their birth rate is low (in the example it is 78%). In this case there has been an “over-mating”, that is to say, sows that aren’t really in estrus are mated 4-5 days post weaning, and therefore later on present problems (acyclic returns, slaughtered due to barrenness).
So, analysis of the consequences of each type of management is fundamental. We can conclude that a short weaning to service interval isn’t always a synonym for good management, since we have to take into consideration not only average number of days, but also the effect on the percentage of distribution after returns.