Data sheets: Soybean meal (44-48% CP)
26-Oct-2018 (7 years 8 months 19 days ago)
Introduction
Soybean (Glycine max) is a legume included in the Fabaceae family and classified as an oilseed. It is a plant of Asian origin, autogamous and photoperiod-sensitive. Autogamy has allowed the development of GMO varieties in the USA. There are from short-season (90 days) to very-long-season (200 days) varieties. Although the growing of the GMO varieties is not allowed in the EU, their commercialisation is allowed.
Soybean meal is a by-product of soybean oil extraction, and it is a high-quality protein and energy source for animal feeding. The soybean meals commonly used to produce feed come from the extraction process that uses pressure and solvents, with a thermal treatment of the soybean, this yielding meals with a high protein concentration (±48%). With the partial adding of the hull we obtain the different protein percentages normally used at a commercial level.
It is an ingredient with a high food value, because it represents the main protein and essential amino acids source for livestock, being rich in lysine, although relatively poor in methionine and tryptophan. Nevertheless, soybean has a great amount of heat-labile (antitrypsins, urease and lectins, that can be reduced after applying a correct thermal processing) and heat-stable (glycinin and ß-conglycinin, that can cause an immune response, damage the intestinal mucosa and cause diarrhoea in young animals if soybean is not correctly treated) anti nutritional factors.
Production and trade
1. Soybean

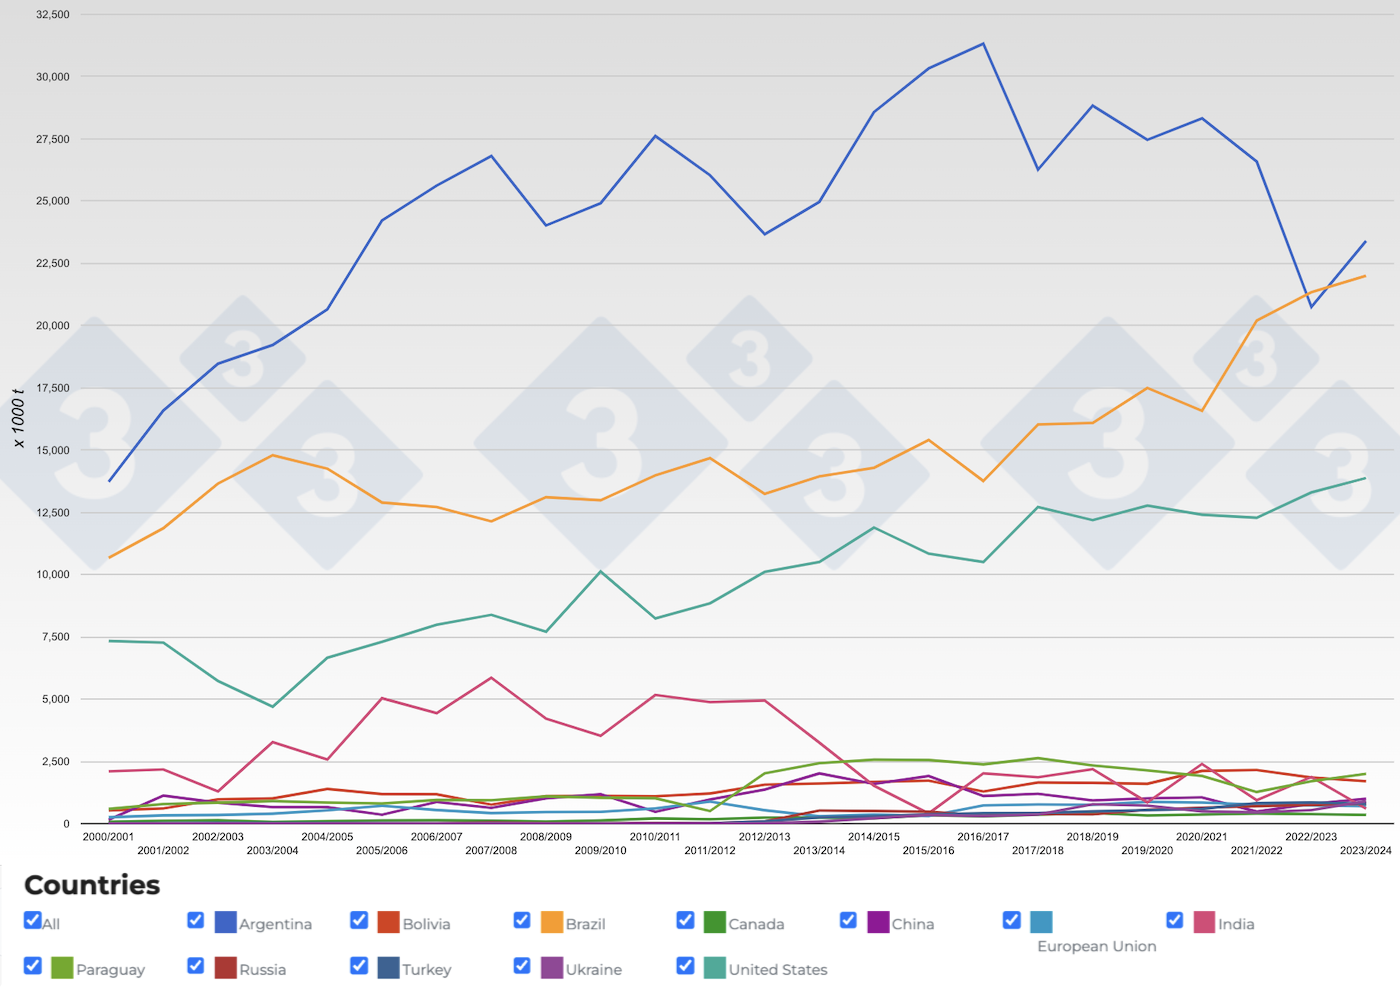
 2. Soybean meal
We must highlight that there are countries with a low soybean production but a high soybean meal production, such as the European Union. This is because a great part of the imported soybean is transformed into meal.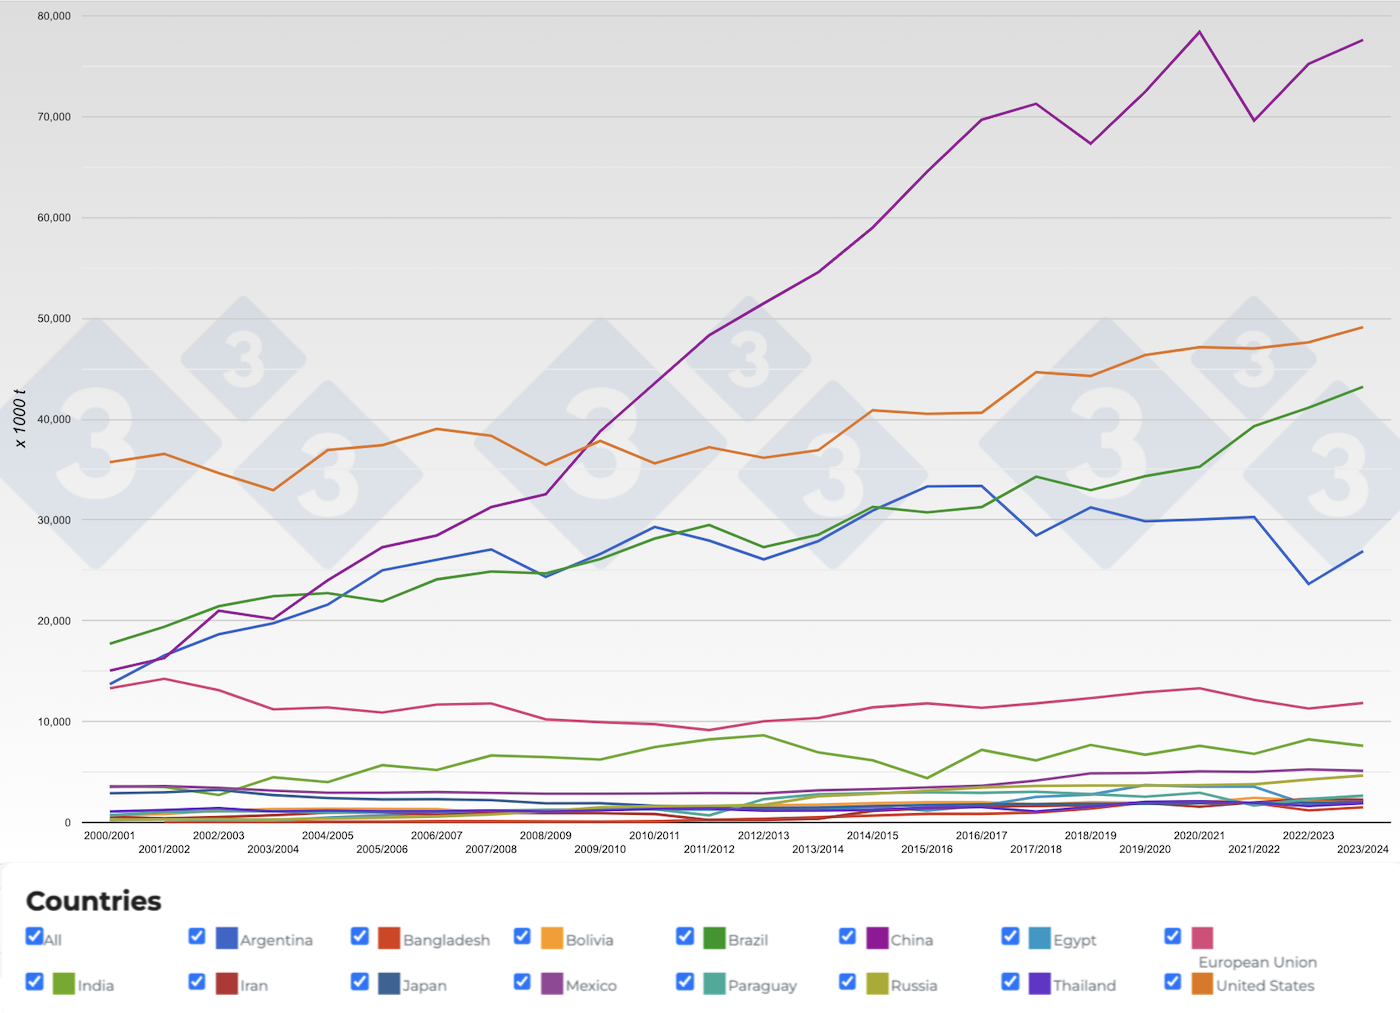
 Comparative studies of the nutritional values
The systems used in the comparison are: FEDNA (Spain), CVB (The Netherlands), INRA (France), NRC (USA) and that of Brazil.
| FEDNA (44) | FEDNA (48) | CVB (44) | CVB (48) | INRA (46) | INRA (50) | NRC (44) | NRC (48) | BRAZIL (44) | BRAZIL (47) | |
|---|---|---|---|---|---|---|---|---|---|---|
| DM (%) | 88.0 | 87.9 | 87.7 | 87.2 | 87.6 | 87.6 | 88.8 | 89.0 | 88.1 | 88.8 |
| Energy value (kcal/kg) | ||||||||||
| Crude protein (%) | 44.0 | 48.5 | 42.6 | 48.5 | 43.3 | 47.2 | 43.9 | 47.7 | 44.1 | 48.1 |
| Ether extract (%) | 1.9 | 1.9 | 2.2 | 1.9 | 1.7 | 1.5 | 1.2 | 1.5 | 1.1 | 1.1 |
| Crude fibre (%) | 5.9 | 3.2 | 6.0 | 3.7 | 6.1 | 3.9 | 6.6 | 3.9 | 5.4 | 4.6 |
| Starch (%) | 0.1 | 0.5 | 0.9 | 0.8 | 0.0 | 0.0 | 1.9 | 1.9 | 1.9 | 3.0 |
| Sugars (%) | 7.0 | 7.0 | 9.1 | 10.3 | 8.5 | 9.2 | - | - | - | - |
| ME growing pigs | 3,070 | 3,265 | - | - | 3,170 | 3,290 | 3,382 | 3,294 | 3,118 | 3,253 |
| NE growing pigs | 1,950 | 2,025 | 1,964 | 2,048 | 1,920 | 2,000 | 2,148 | 2,087 | 1,947 | 2,043 |
| NE sows | 2,110 | 2,195 | 1,964 | 2,048 | 2,070 | 2,120 | 2,148 | 2,087 | 2,036 | 2,120 |
| Protein value | ||||||||||
| Crude protein digestibility (%) | 85 | 87 | 86 | 88 | 87 | 90 | 85 | 87 | 90 | 91 |
| Amino acid composition (%) | ||||||||||
| Lys | 6.08 | 6.16 | 6.20 | 6.20 | 6.10 | 6.10 | 6.29 | 6.20 | 6.17 | 6.05 |
| Met | 1.35 | 1.46 | 1.40 | 1.40 | 1.40 | 1.40 | 1.37 | 1.38 | 1.34 | 1.31 |
| Met + Cys | 2.83 | 2.97 | 2.90 | 2.90 | 2.90 | 2.90 | 2.92 | 2.85 | 2.81 | 2.83 |
| Tre | 3.91 | 3.96 | 3.90 | 3.90 | 3.90 | 3.90 | 4.01 | 3.90 | 3.92 | 3.89 |
| Trp | 1.30 | 1.35 | 1.30 | 1.30 | 1.30 | 1.30 | 1.34 | 1.38 | 1.41 | 1.39 |
| Ile | 4.45 | 4.56 | 4.60 | 4.60 | 4.60 | 4.60 | 4.46 | 4.48 | 4.69 | 4.64 |
| Val | 4.70 | 4.90 | 4.80 | 4.80 | 4.80 | 4.80 | 4.40 | 4.67 | 4.89 | 4.76 |
| Arg | 7.22 | 7.30 | 7.50 | 7.50 | 7.40 | 7.40 | 7.22 | 7.23 | 7.38 | 7.26 |
| Standardised ileal digestibility (%) | ||||||||||
| Lys | 88 | 91 | 88 | 90 | 90 | 92 | 88 | 89 | 90.1 | 91.2 |
| Met | 89 | 92 | 89 | 91 | 91 | 93 | 89 | 90 | 91.8 | 92.5 |
| Met + Cys | 86 | 90 | 85,5 | 87,5 | 89 | 91 | 87 | 87 | 90.3 | 90 |
| Tre | 85 | 88 | 84 | 86 | 86 | 89 | 83 | 85 | 86.4 | 87.5 |
| Trp | 86 | 90 | 87 | 89 | 89 | 91 | 90 | 91 | 89.2 | 90.3 |
| Ile | 87 | 90 | 87 | 89 | 89 | 91 | 88 | 89 | 89.4 | 90.2 |
| Val | 86 | 90 | 86 | 88 | 88 | 90 | 80 | 87 | 88.1 | 89.5 |
| Arg | 92 | 95 | 92 | 94 | 94 | 95 | 92 | 94 | 94 | 94.7 |
| Minerals (%) | ||||||||||
| Ca | 0.29 | 0.29 | 0.31 | 0.30 | 0.34 | 0.34 | 0.35 | 0.33 | 0.24 | 0.35 |
| P | 0.61 | 0.65 | 0.66 | 0.64 | 0.62 | 0.62 | 0.64 | 0.71 | 0.59 | 0.59 |
| Phytic P | 0.40 | 0.43 | 0.46 | 0.45 | 0.37 | 0.37 | 0.36 | 0.38 | 0.37 | 0.36 |
| Available P | 0.19 | 0.21 | - | - | - | - | - | - | 0.22 | 0.23 |
| Digestible P | 0.24 | 0.26 | 0.28 | 0.27 | 0.20 | 0.20 | 0.25 | 0.28 | 0.27 | 0.27 |
| Na | 0.02 | 0.02 | 0.02 | 0.02 | 0.00 | 0.03 | 0.01 | 0.08 | 0.02 | 0.02 |
| Cl | 0.02 | 0.06 | 0.04 | 0.04 | 0.04 | 0.09 | 0.05 | 0.49 | 0.05 | 0.05 |
| K | 2.20 | 2.20 | 2.19 | 2.18 | 2.12 | 2.11 | 1.96 | 2.24 | 1.83 | 2.11 |
| Mg | 0.27 | 0.27 | 0.30 | 0.29 | 0.29 | 0.29 | 0.29 | 0.27 | - | 0.23 |
DE = Digestible energy; ME = Metabolizable energy; NE = net energy; CP = Crude protein
1 Soybean meal with a crude protein content of 44%
2 Soybean meal with a crude protein content of 48.5%
Most of the assessment systems classify soybean meal according to its protein content, this value being the one that gives its name to the product, with the exception of the INRA, that uses the value of the protein content plus the residual fat after the extraction. This provides, for the different tables, a range of between 4 and 5 soybean meals from the extraction process. Nevertheless, for this review the maximum and the minimum values have been chosen (they are the extreme values used at a commercial level). The protein contents are inversely related to the fibre contents, that acts as a dilution factor that mostly determines the final protein content in the commercialized meals (R2 = -0.86). With the exception of Brazil, that shows the highest protein digestibility coefficients for both soybean meal qualities, the rest of the systems (FEDNA, CVB, INRA and NRC) show very similar digestibility coefficients between them. In the case of soybean meal with a high protein content, although the protein digestibility coefficients are similar between the FEDNA, CVB and NRC, the digestibility coefficients applied in the case of INRA and Brazil are higher. It is important to highlight that although in terms of net energy (NE) the NRC gives a higher value (between 180 and 230 kcal/kg more than the rest of the systems) for 44% CP soybean meal than even for 48% CP soybean meal, the NE value for the rest of the systems (FEDNA, Brazil, INRA and CVB) is very similar (less than 100 kcal/kg difference). Regarding 48% CP, the value given to the NE can be considered very similar between the assessment systems. Regardless of the NE values given by the different systems (FEDNA, INRA, NRC or Brazil), we must underline that the CVB offers equations for the prediction of the energy value of soybean meal according to the digestibility coefficients considering, basically, the protein, fat, non-starchy polysaccharides, sugars and starch contents. Nevertheless, the digestibility coefficients assigned to protein, fat and non-starchy polysaccharides are the ones with the greatest influence and variability according to the kind of soybean meal within the 44% and 48% CP range for this system. In general terms (and with the exception of the NRC for 44 % CP soybean meal), and in the same way as for the protein content, the NE value estimate is basically defined by the fibre content, because it conditions the protein content, and both are the determiners of the estimation of the NE value (with R2 = 0.77 in the positive sense, and R2 = 0.67 in the negative sense, for protein and fibre, respectively). The content in starch also shows a positive relationship with the energy content that is not negligible, and it even has a greater influence than the residual fat content.
In terms of total amino acids, and taking lysine as the reference, we can see that in the case of 44% CP soybean meal, whilst the FEDNA and INRA provide very similar values, the NRC, CVB and Brazil provide higher lysine content values (but the differences never exceed 3,5%). Nevertheless, in the case of 48% CP soybean meal, the INRA and Brazil show similar higher values than the NRC, CVB and FEDNA, that provide lower values that are similar between them. The values for the rest of the total amino acids are quite proportional to lysine for the different soybean meal qualities. The lysine digestibility coefficient has a range of between 88% (FEDNA, CVB and NRC) and 90% (INRA and Brazil) for 44% CP soybean meal. Nevertheless, the NRC is the one that shows the least differences between 44% CP and 48% CP soybean meal, with the CVB, FEDNA and Brazil providing values of 90-91%, and the INRA stands out with 92%.
Recent findings
- Fermented corn-soybean meal increased IGF1 levels in growing-finishing pigs.
Fermented corn-soybean meal could significantly increase the binding of C/EBPβ to the IGF1 promoter and promote hepatic IGF1 expression and production, therefore boosting pig growth. - Effects of the high inclusion of soybean meal and a phytase superdose on the growth performance of weaned pigs housed under the harshness of commercial conditions.
Soybean meal levels in early nursery diets can be increased without decreasing growth performance and may be favourable in pigs originating from PRRS-positive sow farms by reducing the costs of medical treatments. Supplementation of phytase at superdose levels can improve the growth performance regardless of the level of soybean meal in the diet. - Evaluation of a bioprocessed soybean meal on the performance and immune status of nursery pigs.
The bioprocessed soybean meal is a suitable alternative for fish meal and/or spray dried plasma in Phase I and II nursery diets based on pig growth. The prolonged hypersensitivity to ovalbumin (OVA) indicates that bioprocessed soybean meal may have a positive impact on the pig immune function and the 2-fold increase in anti-OVA IgG warrants further investigation on the impact of bioprocessed soybean meal on pig immune function. - Comparison of the amino acid digestibility of full-fat soybean, two soybean meals, and peanut flour between broiler chickens and growing pigs.
The digestibility of crude protein and most amino acids was lower in broiler chickens than in pigs, but the pattern of differences in the digestibility of the amino acids between the ingredients was similar between broiler chickens and pigs. - Amino acid utilization and body composition of growing pigs fed processed soybean meal or rapeseed meal with or without amino acid supplementation.
Soybean processing negatively affects nutrient retention and post-absorptive utilization of digestible amino acids (SID) for their retention. The effects of the processing were compensated by supplementing synthetic amino acids. - Effect of replacing conventional soybean meal with low-oligosaccharide soybean meal on growth performance and carcass characteristics of wean-to-finish pigs.
The reduction in oligosaccharides by replacing conventional soybean meal with low-oligosaccharide soybean meal in the early, late, or entire phase of the wean-to-finish period did not improve the growth performance and carcass characteristics of the pigs. - Chemical composition and amino acid digestibility of soybean meal produced in the United States, China, Argentina, Brazil or India.
The standardized ileal digestibility of crude protein and amino acids is dependent on the country where the soybean meal is produced. This difference and the variability within each country should be evaluated when formulating diets for pigs. - Amino acid digestibility in soybean meal sourced from different regions of the United States and fed to pigs.
The protein value is not different among soybean meal produced in the United States regardless of the location of the processing plants. - Effect of replacing conventional soybean meal with low-oligosaccharide soybean meal fed to weanling piglets.
Low-oligosaccharide soybean meal reduced the intestinal digesta viscosity but had no effects on the growth performance and intestinal morphology when fed to piglets during the first 2 weeks after weaning. - Nutritive value of extruded or multi-enzyme supplemented cold-pressed soybean cake for pigs.
The multi-enzyme used in this study improved the digestibility of some amino acids, but had a limited effect on the energy digestibility, and hence the net energy value of the cold-pressed soybean cake. - Effects of soybean isoflavone on intestinal antioxidant capacity and cytokines in young piglets fed oxidized fish oil.
Dietary supplementation of isoflavone could partially alleviate the negative effect of oxidized fish oil by improving the intestinal morphology as well as the antioxidant ability and immune function in young piglets.
References
Foreign Agricultural Service. USDA. https://apps.fas.usda.gov/psdonline/app/index.html
FEDNA: http://www.fundacionfedna.org/
FND. CVB Feed Table 2016. http://www.cvbdiervoeding.nl
INRA. Sauvant D, Perez, J, y Tran G, 2004, Tables de composition et de valeur nutritive des matières premières destinées aux animaux d'élevage,
NRC 1982. United States-Canadian Tables of Feed Composition: Nutritional Data for United States and Canadian Feeds, Third Revision.
Rostagno, H,S, 2017, Tablas Brasileñas para aves y cerdos, Composición de Alimentos y Requerimientos Nutricionales, 4° Ed,