Data, hormones and holidays (2/2)
18-May-2015 (11 years 1 months 27 days ago)
Why synchronize? Second part
In our previous article we discussed the management of a farm that uses hormones continuously to synchronize farrowings and heats, and explained the reasons why this farm had chosen this type of management.
The next question we should ask ourselves is whether this management somehow affects the reproductive efficiency of the farm.
In order to assess this, we study the farm productivity "tree" or diagram for weaned piglets / serviced sow / year.
Productivity diagrams are a very useful analysis tool, showing and linking the main indicators of efficiency, while also weighing the importance of each one (the further down in the tree, the less global influence).
The following graph shows two 12-month and 4-month periods.
Figure 4. Productivity tree, 1-year and 4-month periods
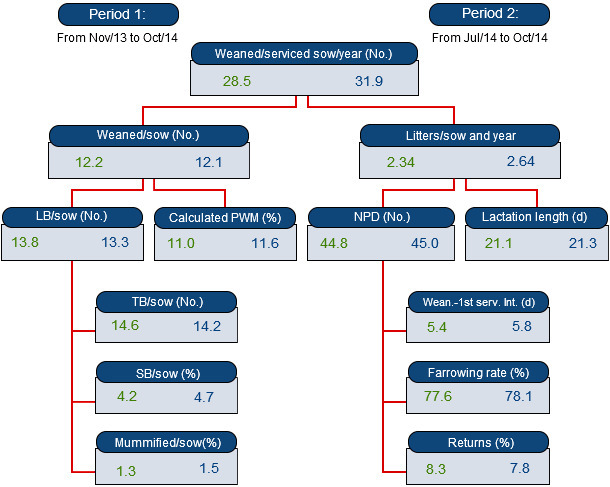
Overall farm productivity is very high; a low lactation length, which helps get more litters per sow and year, obviously also helps. If we analyse the gestation and farrowing quarters, we observe the following:
- In the farrowing quarters, the efficiency level is high, with more than 12 piglets weaned per sow on average. The farm has a high prolificacy rate, and the low rates of stillbirths and pre-weaning mortality show that current management is being successful in the farrowing phase.
- There is a parameter, the farrowing rate (< 80%), that stands out negatively in the gestation phase. Taking this into account, we might think that the poor performance in gestation is due to an excessive use of hormones in order to schedule services. However, the following table proves this theory false in the case of this farm. This table shows the results of services per parity in the farm.
Table 3. Results of services per parity, two-year period
| Parity | ||||||
| 0 | 1 | 2-4 | 5+ | Total | % | |
| 1st services | 332 | 357 | 758 | 330 | 1777 | |
| % sows serviced | 18.7% | 20.1% | 42.7% | 18.6% | 100% | |
| Weaning-service interval | 4.8 | 4.7 | 4.8 | 4.7 | ||
| Return | 23 | 68 | 26 | 2 | 119 | |
| As % of all losses | 46.9% | 61.8% | 20.3% | 2.1% | ||
| Early return | 0 | 0 | 0 | 0 | 0 | |
| Acyclic return | 3 | 9 | 6 | 0 | 18 | |
| Late return | 20 | 59 | 20 | 2 | 101 | |
| Cyclic returns 1 | 0 | 0 | 0 | 0 | 0 | |
| Return rate | 6.9% | 19.0% | 3.4% | 0.6% | 6.7% | |
| Returns average interval | 62.1 | 59.4 | 59.2 | 56.0 | 59.8 | |
| Average NPD | 119 | 64 | 64 | 62 | 74.6 | 36.6% |
| Dead | 8 | 5 | 7 | 3 | 23 | |
| As % of all losses | 16.3% | 4.5% | 5.5% | 3.2% | 6.0% | |
| As % of 1st service | 2.4% | 1.4% | 0.9% | 0.9% | 1.3% | |
| Average NPD | 123 | 63 | 76 | 83 | 90.2 | 36.6% |
| Sold or abattoir | 17 | 37 | 95 | 89 | 238 | |
| As % of all losses | 34.7% | 33.6% | 74.2% | 94.7% | 62.5% | |
| As % of 1st service | 5.1% | 10.4% | 12.5% | 27.0% | 13.4% | |
| Average NDP | 144 | 75 | 46 | 40 | 55.1 | 54.1% |
| Total failures | 49 | 110 | 128 | 94 | 381 | |
| As % of 1st service | 14.8% | 30.8% | 16.9% | 28.5% | 21.4% | |
| Average NPD | 130 | 68 | 51 | 42 | 63.7 | 100.0% |
| Late | 0 | 1 | 1 | 1 | 3 | |
| Average NPD | 786 | 925 | 478 | 729.7 | ||
| Farrowed | 283 | 246 | 629 | 235 | 1393 | |
| Delayed farrowing | 0 | 0 | 0 | 0 | 0 | |
| Farrowing rate | 85.2% | 68.9% | 83.0% | 71.2% | 78.4% | |
| (more than 125 days) | 100.0% | 100.0% | 100.0% | 100.0% | 100.0% | |
| Average born alive | 13.4 | 12.3 | 14.2 | 13.9 | 13.7 | |
| Average stillborn | 0.4 | 0.4 | 0.7 | 1.1 | 0.6 | |
The following are noticed:
- The farrowing rate of gilts (parity 0) and those with 2 to 4 parities is correct. These sows have been treated with hormones, so the conclusion is that the use of hormones does not have a negative impact on the performance of sows. We must bear in mind that, under normal conditions, hormones are used to induce oestrus only in problematic sows, and it is expected that their performance may be lower, hence —perhaps— their "bad reputation".
- The farrowing rate of sows in parity 1 is already very low. In this case, there is a very bad "First Parity Syndrome" in the farm, where sow's efficiency after the first lactation is much lower, not only in fertility but also in prolificacy terms.
- The efficiency of older sows (from parity 5) is also lower, due in this case not to returns, but to the slaughter of these sows. The farm management in this case is really curious: many of the older sows are serviced instead of removed after weaning; later on, after gestation has been confirmed, they decide how many of them will be removed in order to balance the number of pregnant sows on each batch. This management involves the removal of some pregnant sows, and the accumulation of NPD, but the strict control of production rates is a priority for the farm.
This article explains what the management is like in a farm where workload scheduling and synchronization and stability of production rates are priority areas, and details how they achieve this through the massive use of reproductive hormones that help synchronize heats and farrowings. At the other end would be all those farms where such hormones are not used, with their advantages and disadvantages. Such farms will be the subject of a future article.